Bear Densities & Habitat
It is a basic ecological truth that animal densities reflect habitat productivity. There are certainly other factors that affect density, including predation, disease, and competition, but food abundance and related concentrations of nutrients and energy are a fundamental determinant of how many animals can live on a particular piece of ground. This holds every bit as much for grizzly bears as for any other animal. Even so, there seems to be confusion about this link between habitat and densities stemming from the fact that grizzlies are omnivores. The argument goes something like this: "because grizzly bears are omnivores, their diets are flexible and, because of this, one food can be substituted for another with little effect on the population." Perhaps needless to say, this argument is nonsense. Bear foods offer a wide range of energetic and nutritional benefits, with ample demonstrated effects on growth, reproduction, and survival (see Nutrition and Extirpations). Not all foods are equal. And food abundance matters. Even for a bear. What follows is some evidence in support of this truth.
Estimating Densities, Distributions, and Total Population Sizes of Extirpated Grizzly Bears in the Contiguous United States
Of relevance to this section, you can download a technical report by clicking on the highlighted link or the image at right that contains all of the density estimates for grizzly bear populations in North America that I've been able to find, and then have used here. The report also contains an estimate of grizzly bear population sizes for the contiguous U.S. that builds on estimates of contemporary grizzly bear densities.

The map at right represents my estimation of current grizzly bear densities in North America. The supporting sources include official maps published by the Provinces of Alberta and British Columbia, a dataset assembled by Garth Mowat, several papers on grizzly bear densities in Alaska (including a seminal monograph by Sterling Miller and colleagues), a review of grizzly bear status in Canada by COSEWIC, plus sundry other papers and reports.
Perhaps the most obvious pattern is one of very high grizzly bear densities along the Pacific coast (in excess of 40 and, in places, 175 bears per 1000 km2), unambiguously associated with availability of abundant spawning anadromous salmonids. Bear densities along the coast are as much as 10-20 times higher than densities in many parts of the interior.
But even in the interior grizzly bears densities vary by 5-fold. The lowest densities are found either in the Barren Grounds of Canada, or along the southern margins of grizzly bear distribution in areas with a combination of high human, livestock, and black bear densities; as well as a history of nearby human-caused extirpations (see The Holocene). But perhaps the key point is that grizzly bear densities in interior North America systematically vary in accord with differences in habitat. This is on top of the dramatic gradient associated with availability of spawning salmon.
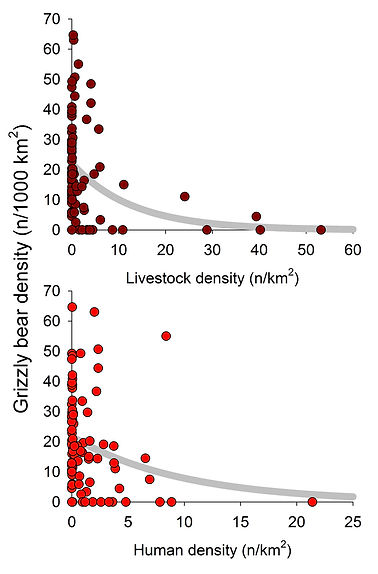
Garth Mowat assembled and made publicly available a dataset comprised of all the density estimates made for grizzly bear populations in North America along with a number of measures that he thought potentially explained variation in these densities. He published the results of his analysis in a paper in PLoS One. I reanalyzed the data; my results are summarized in graphic form to the right and below.


My model of grizzly bear densities in the interior of North America had two parts. The first part contrasted areas that had grizzlies (density >0) with those that had none (density=0); the second part modeled density as a continuous variable for populations where density was >0. Significant explanatory variables are shown in the bar chart above along with the magnitude of each effect, at least at reckoned by standardized regression coefficients. I've also shown univariate relations between density and some of the more important explanatory variables in the x-y figures to the left and below.
Areas with grizzlies were strongly differentiated from areas without grizzlies (Somers' D = 0.99) by being much wetter and somewhat colder. Otherwise, bear population densities tended to be (R2 = 0.70) higher in areas with greater evapotranspiration, greater herb and shrub cover, somewhat more rugged terrain, lower livestock densities, and where grizzlies ate less terrestrial meat (either ungulates or rodents). In other words, grizzly bear densities tended to be lower in flat, more arid areas with comparatively greater forest cover, where the bears also tended to rely more on meat (e.g, drier interior boreal forests,; see History).
These patterns fit with where the highest densities of grizzlies in interior regions are shown in the map at the top of the page, primarily in British Columbia and along the North Fork of the Flathead on the BC-Montana border. These enclaves tend to be found in wet and productive mountainous areas with extensive open areas containing abundant berry-producing shrub species (primarily huckleberry). These areas also tend to have few livestock and few people.
A few comments are warranted on the most important explanatory variables: Actual evapotranspiration logically correlates with primary productivity in that it betokens total throughput of moisture as a function (primarily) of precipitation and temperature. In other words, the wettest warmest areas tend to produce the greatest annual vegetal growth. These kinds of areas would likely yield the greatest amounts of vegetal foods for bears. On top of this (for reasons that I elaborate on under Life Strategy), grizzlies are uniquely adapted to open environments, which also often support an abundance of berry-producing shrubs. And, finally, of the factors with a positive effect, terrain ruggedness has often been viewed as a surrogate for habitat diversity and, along with it, diversity of foods that would help see animals such as bears through annual ups and downs in availability of key foods.
And then there are the factors with negative effects on grizzly bear densities: human and livestock densities, and consumption of terrestrial meat. The last two factors were included in my multi-variable model, whereas human density was not--at least not in the best performing model. But there is a negative relationship between bear and human densities when examined in simple x-y form (shown bottom right along with the negative relationship to livestock densities at top right).
The negative relations between contemporary grizzly bear densities and densities of livestock and humans are not surprising. Most adult grizzlies (which is to say, 80-90%) die from human causes. In agricultural landscapes, these causes often organize around conflict over livestock (see The Lethality Factor). Moreover, extirpations of grizzlies in the contiguous US between 1850 and 1970 were strongly correlated with human densities (see Extirpations). It would probably be fair to say that we humans and our domesticated animals have been, and continue to be, one of the the most important constraints on where grizzly bears can live.
A final word on the meat-eating effect: On the face of it, there is no self-evident reason why grizzly bears densities would be lower, all else equal, where they eat more meat. Meat is a high quality food (see Nutrition). Perhaps some of the explanation can be found in correlations between meat-eating and habitat. As it turns out, grizzlies tend to eat more terrestrial meat in flatter drier areas (see Current diets). It could be that (in context of a multi-variable model) meat eating conveys information about underlying habitat consitions; specifically, lack of vegetal productivity.